Back Pain Diagnoses Dropped in 2020. Anxiety Diagnoses Never Paused.
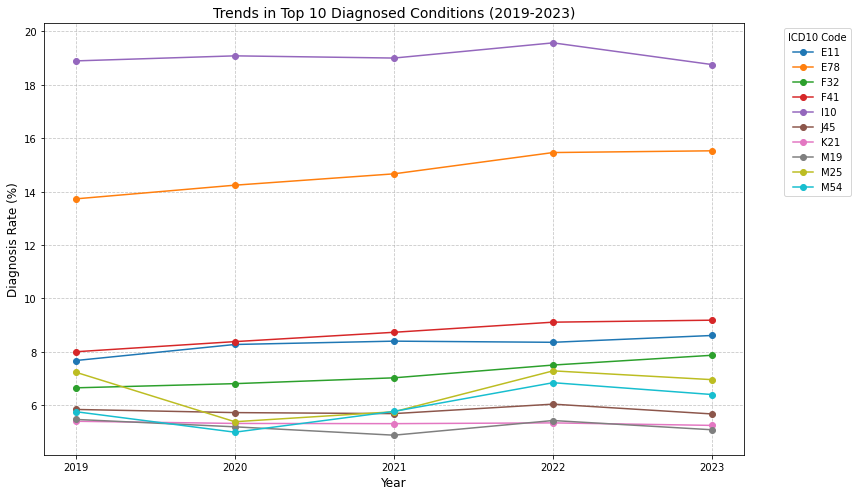
A "top 10 most diagnosed conditions" list is usually shown as a single ranked snapshot, as if the order were a fixed fact. It isn't — it's five years of data compressed into one sorted table. The question behind this one asked for the unfrozen version:
"What are the top 10 most frequently diagnosed conditions by ICD10 across all years, and how have rates trended since 2019?"
VerbaGPT joined MEPS's condition table to its person-level table in Snowflake — all_years_conditions to all_years_narrow, on person ID and year — weighting every diagnosis by the survey's annual person weight and excluding MEPS's own missing-data sentinel codes (-1, -7, -8, -15) before ranking. Across the pooled 2019–2023 sample, ten 3-character ICD-10 codes account for more diagnosed conditions than any others:
| ICD-10 | Condition | Weighted Diagnoses, 2019–2023 |
|---|---|---|
| I10 | Hypertension | 315.5M |
| E78 | Hyperlipidemia (high cholesterol) | 243.8M |
| F41 | Anxiety disorders | 143.7M |
| E11 | Type 2 diabetes | 136.8M |
| F32 | Depression | 118.7M |
| M25 | Joint disorders | 108.0M |
| M54 | Back pain | 98.5M |
| J45 | Asthma | 95.8M |
| K21 | GERD (acid reflux) | 88.0M |
| M19 | Osteoarthritis | 86.2M |
None of that ordering is surprising — hypertension and high cholesterol leading a U.S. health survey is the expected result. What the ranking hides is that it's an average, and 2020 was not an average year for how people accessed healthcare. Broken out year by year, most of these ten lines move the way a slow demographic trend should. Two don't.
The Two Lines That Broke
Joint disorders (M25) and back pain (M54) both fell sharply between 2019 and 2020 — M25 from 7.23% of the population to 5.38% (a 25.6% relative drop in a single year), M54 from 5.76% to 4.99% (down 13.4%). Both then climbed back, past their 2019 starting point, by 2022. That's a dip-and-recover shape, and it lines up with a condition type that's hard to diagnose without an in-person exam: a joint or back complaint typically gets coded after a physical assessment or imaging, the exact category of care that got postponed hardest in 2020.
Anxiety (F41) and depression (F32) did the opposite of pause. Anxiety rose from 8.00% in 2019 to 9.18% in 2023 — climbing in every one of the five years, with no exception. Depression rose from 6.65% to 7.87% on the same pattern: five years, five increases, zero reversals. A single up-year in a survey this size could plausibly be noise. Five straight years without a single down-year is a much harder pattern to explain away, and it's the opposite trajectory of the two musculoskeletal codes sitting right next to them in the same top-10 list, pulled from the same people, in the same years.
Neither of the other six codes in the list shows either shape as cleanly — most just drift. That's part of what makes M25/M54 and F41/F32 worth pulling out: they're not the two extremes of a smooth spectrum, they're the outliers against six lines doing something closer to nothing.
Getting from the question to that chart took one join, one weighted aggregation, and one plot — schema resolution ran on gpt-oss-120b, the SQL and matplotlib code on Gemma 4 31b, both hosted on Cerebras; the two queries and the plot executed against Snowflake in 3.8 seconds, and the full round trip, including a review pass before the answer reached the chat, was 12.1 seconds.
Worth being honest about the limits here: MEPS is a household survey, not a census, and the lower-prevalence codes in this list carry more year-to-year sampling noise than hypertension does. A one-year swing in a rarer code deserves some skepticism. But that's exactly why the anxiety and depression lines are the stronger of the two findings — it's not one lucky year, it's a zero-exception run across five.
This wasn't the first time a version of this question got asked, either. A near-identical prompt from earlier — same tables, same idea, one word different — had already been marked helpful, and VerbaGPT reused that approved code directly rather than writing the join from scratch, sentinel-code exclusions included. That's the same mechanism regardless of dataset: a question your team has already gotten right once doesn't need to be re-solved from zero the next time someone asks something close to it, whether that's MEPS or whatever's actually in your own warehouse.
Data source: Medical Expenditure Panel Survey (MEPS), person-level diagnosed conditions by ICD-10 code, pooled 2019–2023 (AHRQ). One of VerbaGPT's built-in sample datasources.
Ask your own question about this dataset → The MEPS datasource is live and open — no signup required for a few questions.
Related
Inside China's "Rapid Expansion" Phase, One Five-Year Stretch Barely Grew at All
Mild Diabetes Is Overpriced. Severe Diabetes Is Underpriced. Same Risk Score.
One of the Top 10 "Asthma Drugs" in This Query Wasn't a Drug At All
Every Point on This Rainfall Chart Represents a Decade. Except One.
Healthcare Spending Doesn't Scale Linearly: A Decile Analysis