Healthcare Spending Doesn't Scale Linearly: A Decile Analysis of Cost and Risk
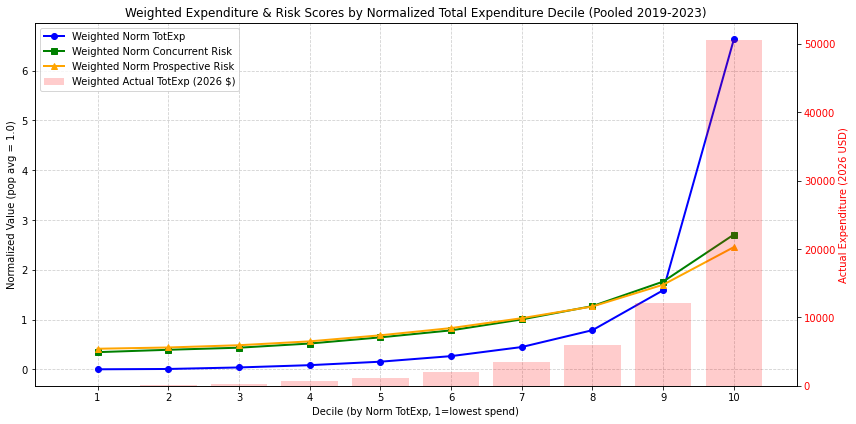
Everyone in health economics knows healthcare spending is skewed — a small share of people account for most of the cost. But "skewed" is a vague word. I wanted an actual number: how much more does the top decile of spenders cost than the decile right below it, and does that gap show up in independent risk-adjustment scores or just in the raw dollars?
I asked VerbaGPT one question against MEPS — the Medical Expenditure Panel Survey, the U.S. government's household health spending survey — pooled across 2019–2023, person-level, ~126,000 rows:
"Create deciles for normalized total expenditure. Then put together a table that shows the weighted normalized total expenditure for the deciles, the actual weighted average total expenditure, and also the average normalized concurrent and prospective risk scores. Give me a bar or line chart or some other visual that relays this info well."
What "Risk Score" Means Here
MEPS carries ACA HHS-HCC risk-adjustment scores at the person level — the same family of models insurers use to price risk pools and CMS uses to adjust Medicare Advantage payments. Two flavors matter here:
- Concurrent risk score — predicted relative cost based on this year's diagnoses.
- Prospective risk score — predicted relative cost next year, based on this year's health status.
Both are normalized so the population average is 1.0. A score of 2.5 means "predicted to cost 2.5x the average person" — independent of what was actually spent.
The Method
MEPS is a household survey, not a census — every record carries a person-weight so the sample reflects the U.S. population. Getting deciles right meant sorting by normalized expenditure, then cutting at boundaries of cumulative survey weight (not raw row count), and weighting every average by that same weight. Dollar figures also needed inflating to 2026 dollars via the medical CPI, since spending was pooled across five separate survey years.
None of that was written by hand — it came out of the one-sentence question above, resolved against the schema description VerbaGPT already had for the table (column meanings, weighting conventions, which columns needed the CPI multiplier).
The Table
| Decile | Weighted Norm. Total Exp. | Weighted Actual Total Exp. (2026 $) | Weighted Norm. Concurrent Risk | Weighted Norm. Prospective Risk |
|---|---|---|---|---|
| 1 | 0.000 | $0 | 0.344 | 0.413 |
| 2 | 0.006 | $49 | 0.392 | 0.438 |
| 3 | 0.037 | $282 | 0.434 | 0.484 |
| 4 | 0.083 | $631 | 0.518 | 0.561 |
| 5 | 0.153 | $1,164 | 0.642 | 0.683 |
| 6 | 0.265 | $2,016 | 0.782 | 0.828 |
| 7 | 0.448 | $3,411 | 1.002 | 1.027 |
| 8 | 0.786 | $5,993 | 1.270 | 1.262 |
| 9 | 1.589 | $12,108 | 1.763 | 1.700 |
| 10 | 6.634 | $50,564 | 2.707 | 2.456 |
Key Findings
- The jump at the top is not gradual. Decile 9 averages $12,108. Decile 10 averages $50,564 — a 4.2x jump in one step, versus roughly 1.7–1.9x between every other adjacent decile pair.
- Risk scores track spending almost linearly — right up until that same top decile, where actual dollars grow faster than the risk score does (6.6x normalized expenditure vs. 2.7x normalized risk). Predicted risk and realized cost move together for nine deciles, then partially decouple at the extreme.
- Decile 7 sits almost exactly at the population average (risk score ≈ 1.0), meaning the median-cost band in this data is actually somewhat below-average risk, not the center of the distribution.
- Concurrent and prospective risk agree closely at every decile, which is itself informative: it says current health status is a good predictor of near-future cost across nearly the whole distribution, not just among the already-sick.
Why the Top-Decile Gap Matters
This is the exact tension that risk-adjustment payment models (ACA marketplace transfers, Medicare Advantage) are built to handle: predicted risk and realized spend should move together, or the entity holding the risk gets paid for a population it isn't actually covering. A dataset where risk and cost track linearly for 90% of the population but diverge at the top decile is precisely where risk-adjustment models are hardest to get right — and where insurers' margins are most exposed to a handful of outlier patients.
Data source: Medical Expenditure Panel Survey (MEPS), Household Component, Full Year Consolidated files, pooled 2019–2023 (AHRQ). Risk scores are ACA HHS-HCC concurrent and prospective model scores, normalized to a population mean of 1.0. Expenditures adjusted to 2026 dollars via the medical care CPI.
Ask your own question about this dataset → MEPS is available as a live public demo datasource on VerbaGPT — no signup required for a few questions.
Related
Same Question, Two Harnesses, Two Very Different Bills
Mild Diabetes Is Overpriced. Severe Diabetes Is Underpriced. Same Risk Score.
One of the Top 10 "Asthma Drugs" in This Query Wasn't a Drug At All
End-to-End Autonomous Data Analysis
A Decision Tree That Ignores Half Its Features — And Still Hits 98%