Inside China's "Rapid Expansion" Phase, One Five-Year Stretch Barely Grew at All
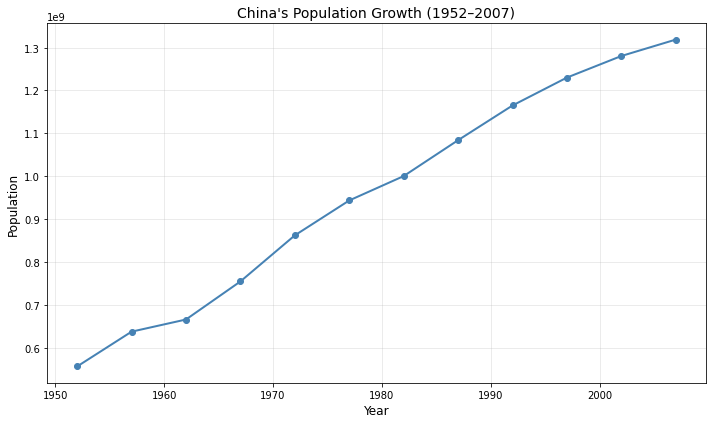
A "how has X grown" question usually gets answered as a start point, an end point, and a percentage — and that framing tends to smooth a trajectory into a story with one or two clean phases. The full data underneath a question like that often has more texture than the summary lets on:
"From the gapminder data, how has China's population grown since 1952?"
VerbaGPT queried China's population at each Gapminder-recorded year from 1952 to 2007 (five-year intervals, Azure SQL), printed the full series, and computed the headline numbers: 556.3 million in 1952, 1.32 billion in 2007, a 137.1% increase. Its own written summary then split that trajectory into two phases — "rapid expansion" from 1952–1982, "moderated growth" from 1982–2007, attributed to the 1979 one-child policy. That's a reasonable read of the endpoints. It's not what the twelve numbers in between actually show:
| Year | Population | Growth vs. Prior Interval |
|---|---|---|
| 1952 | 556,263,527 | — |
| 1957 | 637,408,000 | +14.6% |
| 1962 | 665,770,000 | +4.5% |
| 1967 | 754,550,000 | +13.3% |
| 1972 | 862,030,000 | +14.2% |
| 1977 | 943,455,000 | +9.4% |
| 1982 | 1,000,281,000 | +6.0% |
| 1987 | 1,084,035,000 | +8.4% |
| 1992 | 1,164,970,000 | +7.5% |
| 1997 | 1,230,075,000 | +5.6% |
| 2002 | 1,280,400,000 | +4.1% |
| 2007 | 1,318,683,096 | +3.0% |
The Gap Inside the "Rapid" Phase
Between 1952 and 1957, China's population grew 14.6% — genuinely rapid. Between 1962 and 1967, it grew 13.3% — rapid again. In between, 1957 to 1962, growth was 4.5%: a fraction of the rate on either side of it, and a rate this series doesn't see again until 1992–1997, thirty-five years later. Visually, it's the one flat segment in an otherwise smooth curve — you can see the kink in the chart above without reading a single number.
The "1952–1982: Rapid Expansion" label is true of the phase's endpoints and false of what happens in the middle of it. A single five-year window inside that "rapid" phase actually undergrew four of the five windows that came after 1982, the era the summary calls "moderated." The two-phase story isn't wrong about the destination — population did roughly double in each half-century stretch — but it collapses a stall into a boom because both sit on the same side of an arbitrary 1982 dividing line.
1957–1962 corresponds to China's Great Leap Forward and the famine that followed it (1959–1961) — among the deadliest in recorded history, with excess deaths and a sharp fertility drop that would show up in population figures exactly like this: a five-year interval where growth nearly stops, bracketed by two intervals where it doesn't. VerbaGPT's own generated summary doesn't mention this — it printed the number correctly and then narrated straight past it, because "compare two endpoints, pick a plausible policy inflection" is a much easier story to write than "explain why the third data point breaks the trend."
This run used a different provider path than most of what ends up in this series: schema resolution still ran on gpt-oss-120b (0.4 seconds, this dataset's 108 column embeddings already cached), but the code itself was generated by Zai GLM 5.2 via OpenRouter rather than a Cerebras-hosted model, and the review pass that checked the answer ran on Claude Haiku rather than the Gemma models seen elsewhere in this series — the same task, three different model providers touching it, with no code changed to make that swap happen. The query and print executed in 348 milliseconds; full round trip, 13.3 seconds.
None of this is about China specifically. Any "grew from A to B" narrative — revenue, headcount, signups — is a two-point summary of a series that has more than two points, and the points in between are exactly where a real shock hides if the endpoints happen to land on either side of it. The fix isn't distrusting the summary; it's pulling the full series before trusting a phase label attached to it, the same way this one prompt did automatically.
Data source: Gapminder Foundation population data, China, 1952–2007 (5-year intervals). One of VerbaGPT's built-in ML Demo sample datasets.
Ask your own question about this dataset → The ML Demo datasource is live and open — no signup required for a few questions.