GLP-1 Spending Nearly Quadrupled. Cost Per Patient Peaked in 2021.
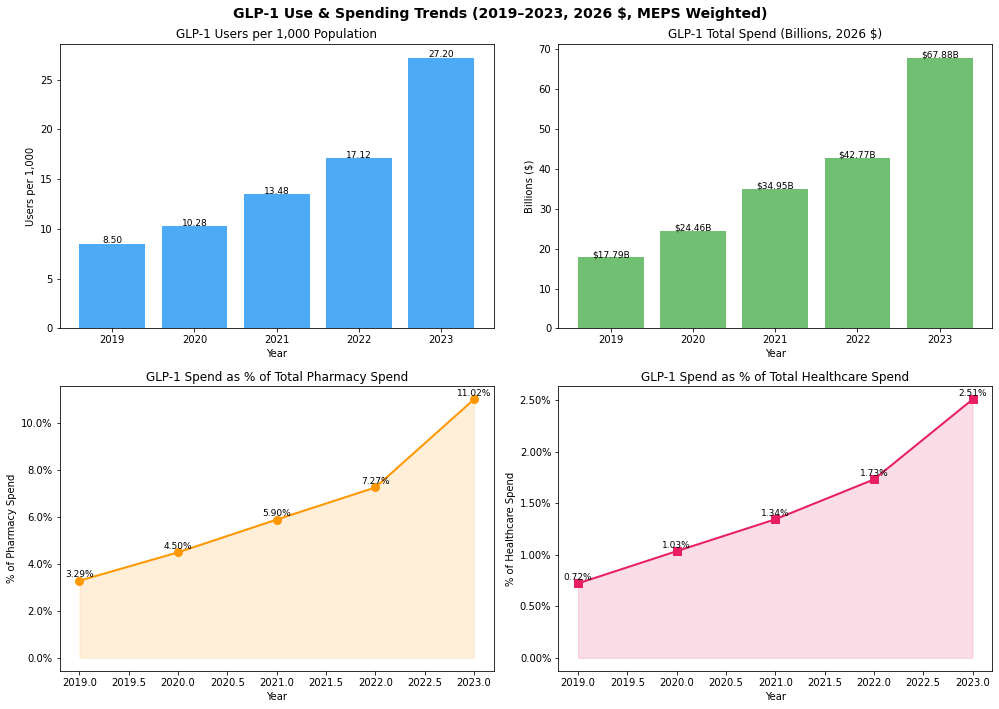
Four charts, one dataset, and every single line points the same direction. That's not automatically a red flag — sometimes a trend really is that clean — but it's exactly the situation where it's worth computing the one number none of the four panels show, because a dashboard built to answer "how much did this grow" has no natural place to put a number that didn't:
"Can you look at the trend in GLP-1 use over the years? Also trace the % it constitutes of pharmacy and overall cost trend. Give me helpful visuals too."
VerbaGPT identified GLP-1 fills in MEPS's prescription table by matching seven active ingredient names (semaglutide, liraglutide, dulaglutide, exenatide, tirzepatide, albiglutide, lixisenatide) against 126,003 person-year records, adjusted every dollar to 2026 terms, and weighted everything by MEPS's national population weights across 2019–2023:
| Year | Users / 1,000 | Total Spend | % of Pharmacy | % of Healthcare |
|---|---|---|---|---|
| 2019 | 8.50 | $17.8B | 3.29% | 0.72% |
| 2020 | 10.28 | $24.5B | 4.50% | 1.03% |
| 2021 | 13.48 | $35.0B | 5.90% | 1.34% |
| 2022 | 17.12 | $42.8B | 7.27% | 1.73% |
| 2023 | 27.20 | $67.9B | 11.02% | 2.51% |
Users per 1,000 up 3.2x. Total spend up 3.8x. Share of pharmacy spend up 3.4x. Share of overall healthcare spend up 3.5x. None of that is surprising given how much attention semaglutide and tirzepatide have gotten since 2021 — this is the trend everyone already expects to see, confirmed with real numbers.
The Number the Dashboard Doesn't Plot
Every one of those four figures is a total or a share — a count of dollars or a count of people. Divide total GLP-1 spend by the number of GLP-1 users in the same year, and a different shape appears:
| Year | Avg. Spend Per GLP-1 Patient |
|---|---|
| 2019 | $6,394 |
| 2020 | $7,245 |
| 2021 | $7,831 |
| 2022 | $7,499 |
| 2023 | $7,461 |
The average GLP-1 patient's annual bill rose 22% from 2019 to 2021 — then, even as total spending nearly doubled again (from $35.0B to $67.9B) and the user base more than doubled (13.48 to 27.20 per 1,000), the per-patient figure didn't follow. It fell 4.7% from its 2021 peak and hasn't recovered. Average cost per fill tells the same story on a finer grain: $1,385 in 2019, peaking at $1,663 in 2021, down to $1,513 by 2023 — a real decline, not a rounding artifact, and not explained by patients filling less often (fills per patient were essentially flat across the period, actually ticking up slightly to 4.93 by 2023).
Put together: from 2021 to 2023, GLP-1 total spending grew 94% and the user base grew 104% — nearly identical rates. Almost the entire post-2021 acceleration in total dollars is a volume story, not a per-patient price story. That cuts against a reasonable-sounding assumption — that spending on this drug class is exploding because each treated patient costs more as premium branded products enter the market — when the MEPS figures, which capture total realized payment across all payers rather than list price, show the opposite: more people, not pricier prescriptions, is what's driving the post-2021 curve.
Getting to that second table wasn't friction-free: the first attempt at this query referenced a column as total_pharm_2026 and hit a KeyError, because Snowflake returns column names in uppercase regardless of how a query aliases them — the loop caught the error, re-ran the same logic with TOTAL_PHARM_2026, and produced the table above on the second pass, all before this ever reached a person to debug. Schema resolution ran on gpt-oss-120b, code generation on Zai GLM 5.2 via OpenRouter, and the two SQL passes together (the one that failed and the one that worked) took under 15 seconds combined.
The general pattern here isn't specific to GLP-1s or healthcare: any "this metric grew N%" headline is a ratio of two things that can each be moving for different reasons, and a dashboard optimized to show growth rarely has a panel for "growth in what, exactly." The fix is one extra division — total divided by count — computed from data that was already sitting in the same table, on your own numbers, not just this one.
Data source: Medical Expenditure Panel Survey (MEPS), prescription fill and person-level expenditure data, pooled 2019–2023 (AHRQ). One of VerbaGPT's built-in sample datasources.
Ask your own question about this dataset → The MEPS datasource is live and open — no signup required for a few questions.
Related
The Newest GLP-1's Off-Label Share Is Already Double Ozempic's
The Income Group With the Lowest GLP-1 Use Isn't the Poorest One
This Group Has the Highest Average Health Spending and the Lowest Typical Spending
A Model Guessed Its Own Result Wrong. The User Never Saw It.