"Women First" Had an Asterisk: What the Titanic Data Actually Shows
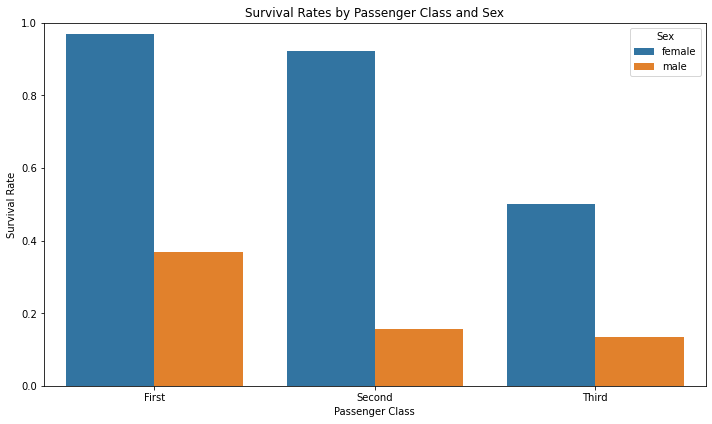
The prompt: "From the Titanic data, show survival rates by passenger class and sex as a bar chart." One query, one grouped average, one chart. The result is the familiar Titanic story — and also, underneath it, a detail the familiar story usually skips.
The Numbers
| Class | Sex | Survival Rate |
|---|---|---|
| First | Female | 96.8% |
| First | Male | 36.9% |
| Second | Female | 92.1% |
| Second | Male | 15.7% |
| Third | Female | 50.0% |
| Third | Male | 13.5% |
The standard reading is: women survived more than men, and richer passengers survived more than poorer ones. Both true. But averaged separately, those two effects hide something a grouped breakdown catches immediately.
The Female Survival Advantage Wasn't Constant
Look at the gap between female and male survival within each class, not the rates themselves:
- First class: 96.8% − 36.9% = 59.9 points
- Second class: 92.1% − 15.7% = 76.4 points
- Third class: 50.0% − 13.5% = 36.5 points
The "being female" advantage was actually largest in second class, not first — and it was smallest by a wide margin in third class. Third-class women had barely better than coin-flip odds (50%), while second-class women survived at a 92.1% clip, almost matching first class (96.8%). Whatever protection "women and children first" provided, it eroded hard at the bottom of the ship, not gradually — third-class women lost 42 points of survival rate versus second-class women, while third-class men lost only 2 points versus second-class men.
In other words: the class penalty hit men early (first → second class) and hit women late (second → third class). The two effects don't combine the way a simple "add the class penalty to the sex penalty" model would predict.
Why This Is the Actual Lesson
Reporting "survival by sex" and "survival by class" as two separate averages — the way this is often summarized — erases the interaction between them. An interaction effect means the impact of one variable depends on the level of another: here, the size of the "female" effect depends on which class you're in. Averaging over groups instead of within them is one of the most common ways a real pattern in data goes unnoticed — not because the numbers are wrong, but because the aggregation throws away the one comparison that mattered.
A single grouped query — split by both variables at once, not each on its own — is what surfaces it. That's what happened here: one SQL GROUP BY passenger_class, sex, no manual cross-tabulation.
Data source: The Titanic passenger dataset (891 passengers, class/sex/survival among the recorded fields) — one of VerbaGPT's built-in sample datasources.
Ask your own question about this dataset → The ML Demo datasource is live and open — no signup required for a few questions.