Two of the Five Strongest Correlations Here Both Come From HDL Cholesterol
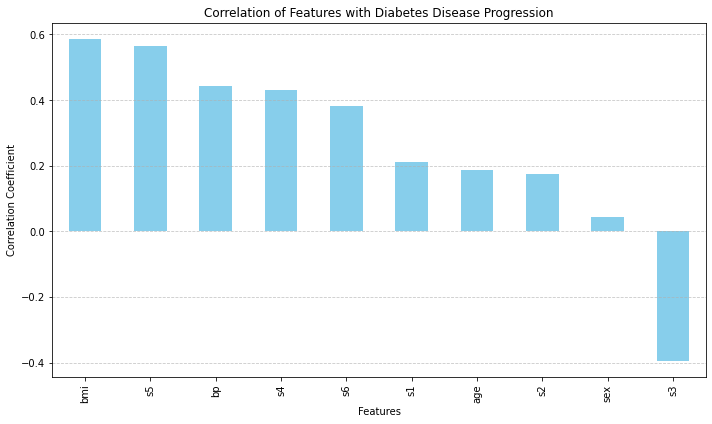
A bar chart ranking ten features by how strongly each correlates with an outcome reads, by default, as ten separate pieces of evidence. That's usually the right way to read it. Here it isn't, for two of the ten:
"From the diabetes data, which features are most correlated with disease progression? Show a bar chart"
VerbaGPT pulled the classic scikit-learn diabetes dataset — 442 patients, ten baseline measurements, Azure SQL's diabetes table inside VerbaGPT's bundled ML Demo datasource — and computed a Pearson correlation between every feature and disease_progression, a one-year severity score:
| Feature | What It Is | Correlation |
|---|---|---|
| bmi | Body mass index | 0.586 |
| s5 | Log of serum triglycerides | 0.566 |
| bp | Average blood pressure | 0.441 |
| s4 | Total cholesterol ÷ HDL ratio | 0.430 |
| s6 | Blood glucose | 0.382 |
| s1 | Total serum cholesterol | 0.212 |
| age | Age | 0.188 |
| s2 | LDL cholesterol | 0.174 |
| sex | Sex | 0.043 |
| s3 | HDL cholesterol | -0.395 |
Nothing about BMI or triglycerides leading this list is surprising — both are established metabolic-risk markers, and this dataset is a well-worn teaching set precisely because it behaves the way domain knowledge predicts. The interesting part is buried in the schema, not the chart: s4 is defined as total cholesterol divided by HDL — and HDL is exactly what s3 already is, on its own, three rows down. One of the "top five" bars in this chart is arithmetically built out of another bar already sitting in the same chart.
Which Half of the Ratio Is Actually Doing the Work
A ratio has two ingredients, and they don't have to contribute equally. s1 — total cholesterol, the numerator of s4's ratio — correlates with disease progression at just 0.212 on its own, the sixth-weakest feature in the whole table. s3 — HDL, the denominator — correlates at -0.395, more than four times stronger in magnitude and the third-strongest feature by absolute value. Of s4's own 0.430 correlation, the HDL component alone accounts for about 92% of that magnitude (0.395 ÷ 0.430); total cholesterol accounts for roughly half as much on its own (0.212 ÷ 0.430 ≈ 49%). The ratio's predictive strength is overwhelmingly HDL's strength, repackaged with a different sign and a slightly different number.
That's not a coding error — s4 was computed correctly, and the correlation is real. It's a labeling problem: a chart with ten bars implies ten features' worth of evidence, when two of those bars are, to a meaningful degree, the same lab draw counted twice under different names. A feature-selection step that grabs the "top N by |correlation|" without checking definitions would pull both s3 and s4 into a model as if they were independent signals, when most of what s4 contributes was already sitting in s3.
Getting from question to chart took one query against Azure SQL and one groupby-free correlation call — schema resolution ran on gpt-oss-120b in 2.5 seconds (this dataset's 108 cached column embeddings made that fast), the code itself came from Gemma 4 31b, both on Cerebras, and the correlation computation and plot executed in 470 milliseconds. The schema response is also where the s4-is-a-ratio fact actually lives — VerbaGPT didn't infer that relationship from the numbers, it read it directly off the column's own stored definition, the same place a human analyst would have to go to catch it.
This kind of derived-feature redundancy isn't specific to cholesterol panels or this dataset. Any table with a raw measurement and a ratio, a rate, or an index built from that same measurement — revenue and revenue-per-employee, a raw score and its z-score, inventory and inventory turnover — can produce the identical illusion: two "independent" bars in a correlation chart that are mostly one signal wearing two names. The chart won't warn you. The column definitions will, if something reads them before the ranking gets treated as a shortlist.
Data source: The scikit-learn diabetes dataset (Efron et al., "Least Angle Regression," 2004) — 442 patients, ten baseline variables, one-year disease progression score. One of VerbaGPT's built-in ML Demo sample datasets.
Ask your own question about this dataset → The ML Demo datasource is live and open — no signup required for a few questions.