More Managers Bought Microsoft Than Sold It. The Sellers Still Won.
The question was simple enough to type in one line:
"Have managers been net buying or selling MSFT over last 3 quarters? Visualize the changes in institutional ownership. Breakdown by location of manager or other interesting dimensions."
The dataset behind it is SEC Form 13F — the quarterly filing every institutional manager with $100M+ under management has to submit, disclosing what they hold. The raw table doesn't even agree with itself on how to spell "Microsoft Corp": nine different CUSIP/name/class-string combinations turned up for a name-based search, from typo'd digit transpositions to a stray COMMON STOC truncation. One of them was real in any economic sense — CUSIP 594918104, with 68,666 filings and $18.4 trillion in cumulative reported value versus roughly $60 million for the next-largest variant. Everything below is scoped to that single CUSIP, deduplicated to the latest amendment per manager per quarter, so an amended filing doesn't get double-counted against the original.
The headline number: net selling, but not in a straight line
| Period | Managers Holding | Total Shares | Q/Q Change |
|---|---|---|---|
| 2025-09-30 | 5,843 | 5.486B | — |
| 2025-12-31 | 6,272 | 5.657B | +170.9M (+3.12%) |
| 2026-03-31 | 6,128 | 5.277B | −380.3M (−6.72%) |
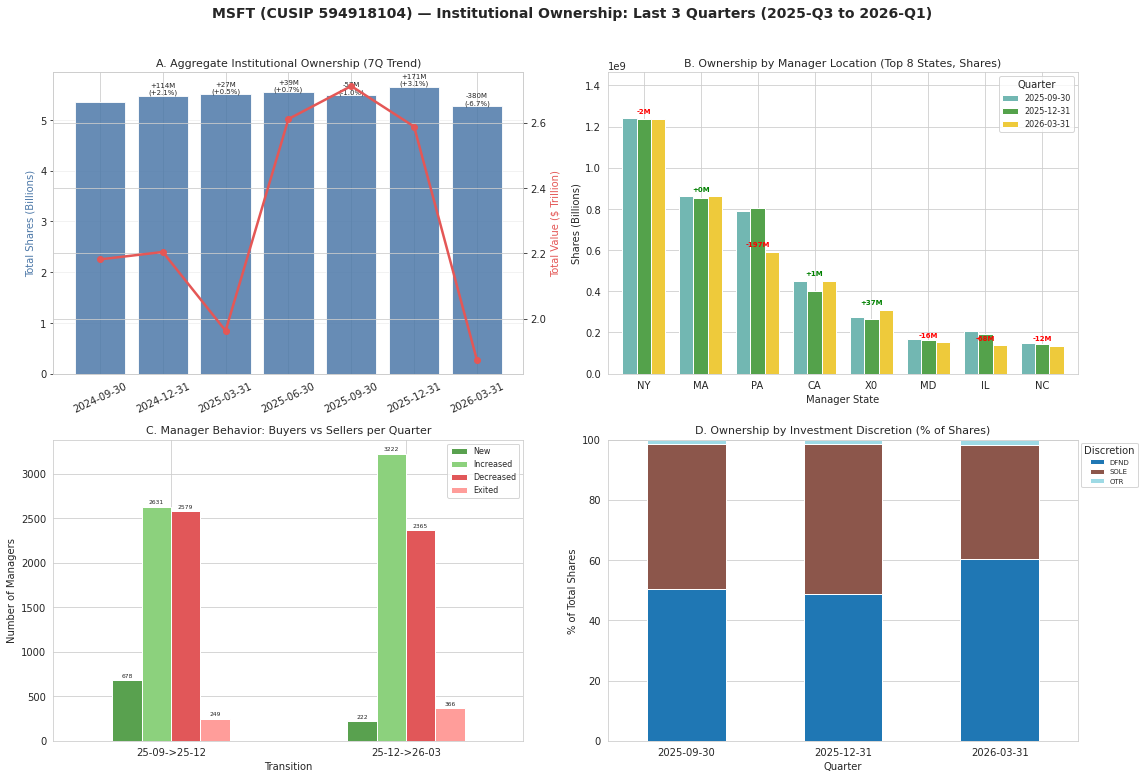
Net across the full three quarters: institutions hold 209.3 million fewer shares (−3.82%), even as the number of managers holding the stock at all rose by 285. Managers bought on net in Q4 2025, then more than reversed it in Q1 2026 — the largest single-quarter contraction of the seven quarters shown in the trend panel.
The part that doesn't fit the headline
Q1 2026 is where it gets interesting. Split the 5,906 managers who held MSFT in both December and March into buyers and sellers, and more of them added to their position than trimmed it: 3,222 increased, 2,365 decreased. By headcount, buyers won two-to-one against sellers, plus another 222 new entrants. And the quarter was still the sharpest net-selling quarter in the whole window.
| Transition | Net Shares | Increased | Decreased | New | Exited |
|---|---|---|---|---|---|
| Sep → Dec 2025 | +170.9M | 2,631 | 2,579 | 678 | 249 |
| Dec 2025 → Mar 2026 | −380.3M | 3,222 | 2,365 | 222 | 366 |
The gap is explained by size, not headcount. Gross buying in Q1 2026 was +899.1M shares against gross selling of −1,279.4M — the average seller moved roughly 541K shares, the average buyer roughly 260K. Twice the conviction on half the crowd was enough to overrule a numeric majority that was, individually, doing less each. It's the kind of thing a plain "N managers bought, M managers sold" summary would get backwards, because breadth and magnitude aren't the same axis and nothing forces them to agree.
The same divergence shows up one layer down, by investment discretion — whether a manager reports sole authority over the position or a defined/shared mandate. In Q1 2026, SOLE-discretion holdings collapsed by about 825M shares (−29% quarter over quarter) while DFND-discretion holdings rose by roughly 421M, flipping DFND's share of total institutional ownership from 48.9% to 60.4% in a single quarter. Whatever drove the selling ran disproportionately through managers with unilateral discretion over the position, not through sub-advised or defined-mandate accounts.
Where the selling actually happened
Geography adds a third layer that a national number hides completely. Two states — Pennsylvania (−197.4M shares, −25.0%) and Illinois (−68.3M, −33.3%) — together account for more than the entire net three-quarter decline. Meanwhile New York, Massachusetts, and California, the three largest US centers by shares held, were essentially flat across the same period. The foreign/other filer cohort (coded X0 in the filings, not a US state) was the single largest net buyer among the top locations, up 13.4%. The national "institutions sold MSFT" headline was, underneath it, a story about two specific states — not something broad-based across the market's biggest holders.
None of this — the CUSIP disambiguation, the amendment dedup, the buyer/seller split, the discretion crossover, the state-level breakdown — was in the prompt. It was one sentence, plus a request to "breakdown by location or other interesting dimensions," left open on purpose.
How the answer actually got built
Schema resolution — figuring out which of the dataset's tables and columns were relevant to a Microsoft ownership question — ran on Cerebras hardware in 0.73 seconds using gpt-oss-120b. The code that queried and plotted the data was written by Meta's Muse Spark 1.2, a newer contributor model being evaluated for this pipeline. It took eight iterative steps to get there, and two of those steps failed outright — a pandas pivot rejected a lowercase column alias that the live connection had actually returned in uppercase, and a later step tripped a restriction inside VerbaGPT's execution sandbox. Both times the model read the actual error, rewrote the offending lines, and moved on without a person touching the session. The last step ran a self-review pass against its own numbers before the answer was finalized. Wall-clock time for the whole exchange — schema resolution, eight code steps against a 16-million-row table, self-review, four-panel chart — was under 100 seconds.
None of this depended on the ticker being MSFT or the dataset being 13F filings specifically. Swap in your own holdings table, your own portfolio, or your own transaction log, and the same question — buyers vs. sellers, broken down by whatever dimension turns out to matter — runs the same way: one sentence in, a checked and self-reviewed answer out.
Data source: SEC Form 13F institutional holdings filings, via SEC EDGAR — deduplicated to the latest amendment per manager (CIK) and reporting quarter.