The Executive Summary Says 11.8%. The Table Two Lines Below It Says 1.18%.
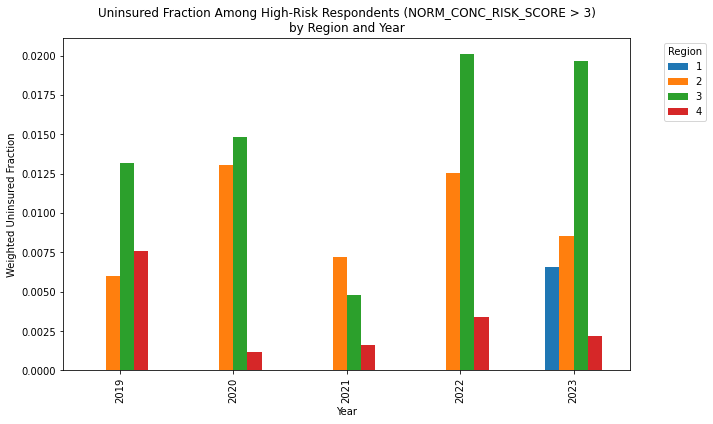
An "Executive Summary" exists so a reader doesn't have to parse the table underneath it. That only works if the summary is describing the same numbers the table contains. In this run, it wasn't:
"What fraction of MEPS respondents with high risk scores (> 3) are uninsured, and how does this vary by region and year?"
VerbaGPT queried MEPS's person-level table for respondents with a normalized concurrent risk score above 3, computed the population-weighted uninsured fraction, and opened its answer with this sentence:
"Across the 2019–2023 period, national uninsured rates among this high-risk population ranged from 3.8% to 11.8%."
Three sections later, in the same answer, the year-by-year table:
| Year | Uninsured Fraction |
|---|---|
| 2019 | 0.79% |
| 2020 | 0.89% |
| 2021 | 0.38% |
| 2022 | 1.16% |
| 2023 | 1.18% |
0.38% to 1.18%. Not 3.8% to 11.8%. The two ranges are the same digits with the decimal point moved one place — a clean 10x gap, in the same document, about the same statistic.
Only One Sentence Is Wrong
The reused SQL — this exact question had a perfect similarity match against a prior, thumbs-up-approved run, and the code was pulled in directly rather than written fresh — computed the fraction correctly and consistently everywhere except that one opening line. The regional table further down (Region 3: 1.45% pooled, the highest; Region 1: 0.12%, the lowest) matches the underlying query output exactly. The region-by-year bullets below that match too. The chart's own y-axis tops out at 0.020 — 2.0%, not 12% — which is itself a quiet confirmation that the real numbers never left the range the table reports. Every part of this answer that came directly from a table or a plot is internally consistent. The one sentence that came from the model summarizing its own findings in prose, before a reader even reaches the first table, is the one that's fabricated.
This run went through a review pass — Haiku Latest checked the answer before it reached the chat — and the review returned no findings. The 10x error wasn't invisible to a human who cross-checked the summary against the table; it was invisible to the specific check this pipeline ran, which apparently didn't include verifying that the headline claim matches the numbers two paragraphs down.
The mechanism worth naming here is what reuse actually protects. The query logic — the part that touched the database, the part institutional memory (a 1.00 thumbs-up match this time) makes more reliable every time it's asked again — was correct and stayed correct. The summary sentence is generated separately, as a paraphrase layered on top of already-correct output, and paraphrasing is exactly the step that doesn't inherit the reliability of the code it's describing. Reused code protects computation. It does nothing for the free-text description written around that computation afterward.
The practical habit this suggests generalizes past MEPS or this one query: any report with a prose summary sitting above a detailed table is, structurally, two independent descriptions of the same numbers — one written in natural language, one computed directly. They usually agree, which is exactly what makes it easy to stop checking that they do. A percentage-point range is one of the cheapest things to spot-check against the table it's summarizing, and it's also one of the easiest places for a decimal point to move without anyone noticing until someone reads both halves of the same page.
Data source: Medical Expenditure Panel Survey (MEPS), person-level risk scores, insurance status, and region, pooled 2019–2023 (AHRQ). One of VerbaGPT's built-in sample datasources.
Ask your own question about this dataset → The MEPS datasource is live and open — no signup required for a few questions.